econWidgets
Jupyter visualisations for Maths & Stats
Table of contents
Overview
About 5 years ago I got tasked with taking over our first year Mathematics for Economics and Statistics for Economics modules. The context was one of poor student engagement, on topics that were seen as a bit dry, with a very wide range of student backgrounds. The key challenge here was to be able to present mathematical and statistical material in a clear and engaging manner. One of the solutions I came up with was to build on the existing functionality of Jupyter Widgets to generate a set of fully interactive plots, which provide intuitive visualisations of key concepts, both at the point of delivery (i.e. a lecture), but also when students go back to the material in their own time. The parameters in the functions plotted in the widget diagrams can be adjusted using sliders or numerical input boxes, and various diagram/plot configuration options can be adjusted using checkboxes or drop-down lists. This enables a very flexible environment for teaching, as the usually static plots shown in a traditional slideshow become dynamic and adjustable in real-time, based either on the story I want to tell in my teaching plan, or (even better) in response to student questions. For statistics in particular, the ability to run Monte Carlo simulations in real-time is invaluable, as a way of getting students to visualise everything to do with sampling distributions.
I use these widgets everywhere: they form the basis of my lecture slides, using the RISE plugin to convert a jupyter notebook into a slideshow, and also in interactive notebooks I provide to students as extra material. The notebooks are available in my interactive teaching GitHub repo, which I make available to students using binder, so that they don’t have to worry about maintaining the appropriate python/jupyter environments.
The sections below provide an overview of the three main types of widgets I use. A full list is available on the econWidgets repo, as well as a demonstration jupyter notebook that provides a demonstration for each widget.
Mathematics widgets
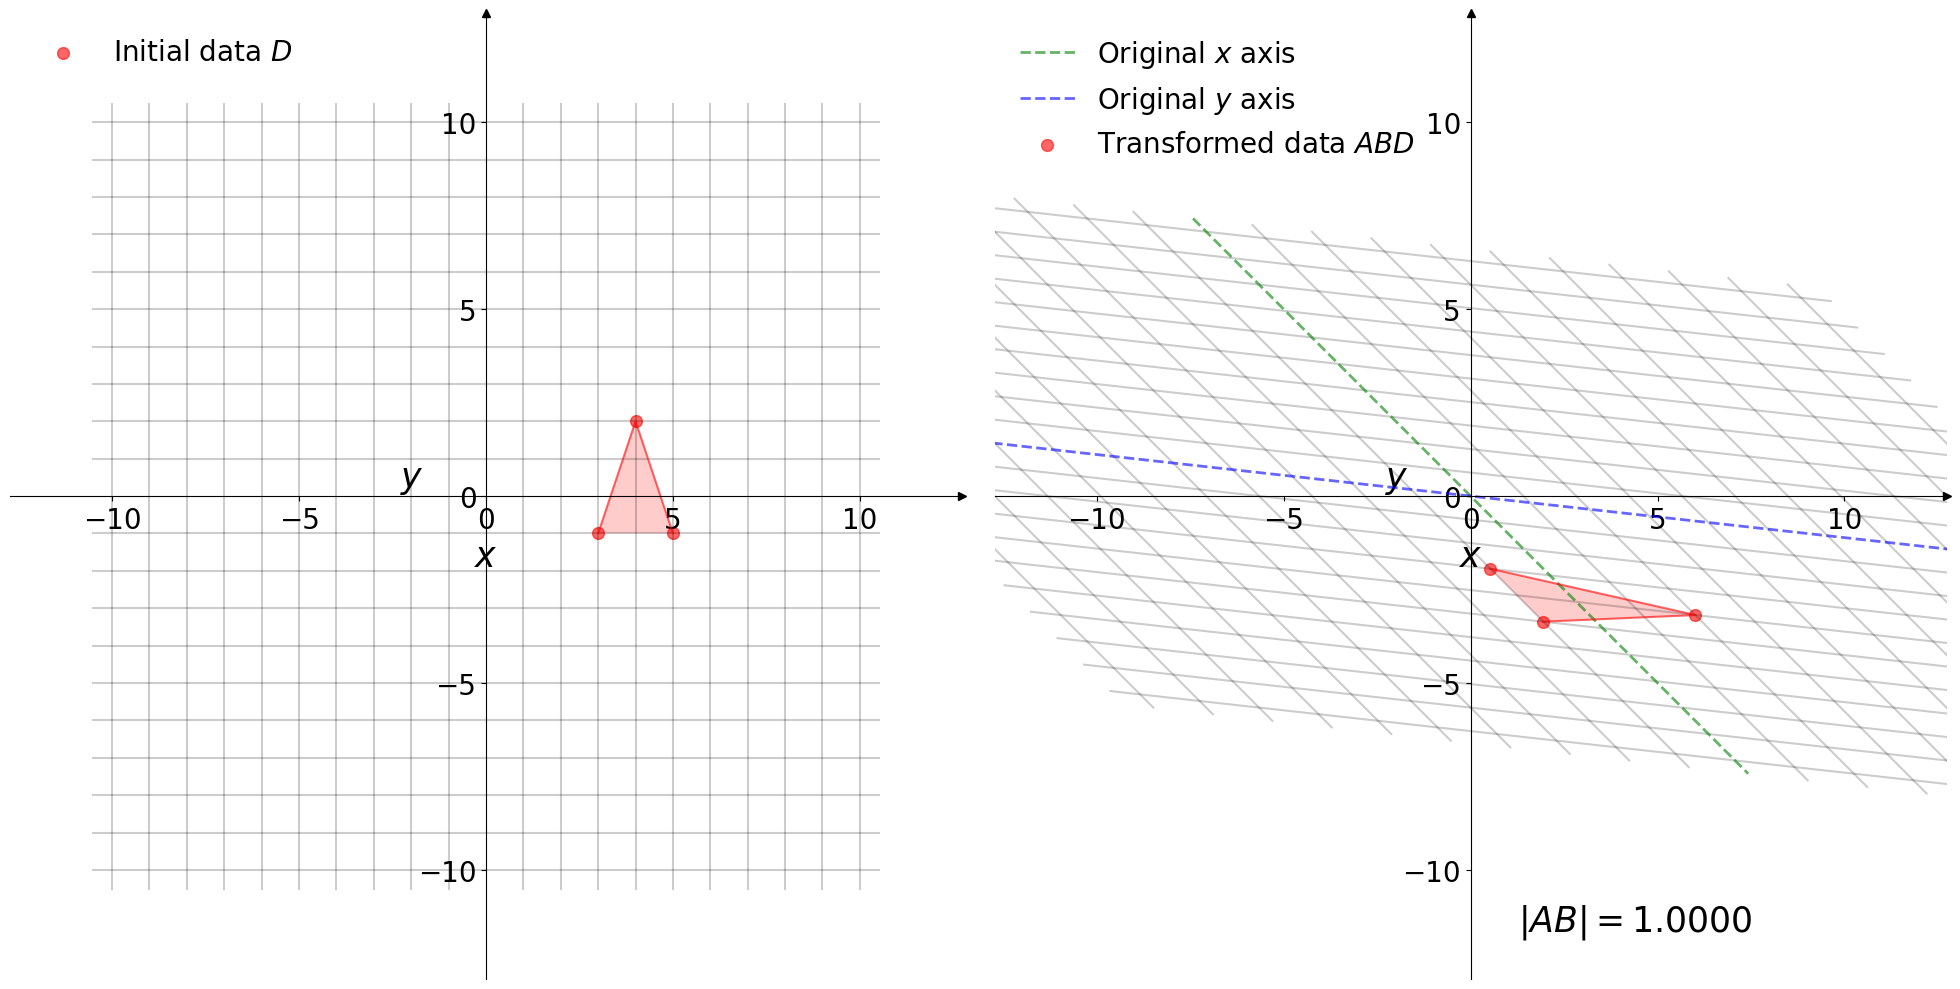
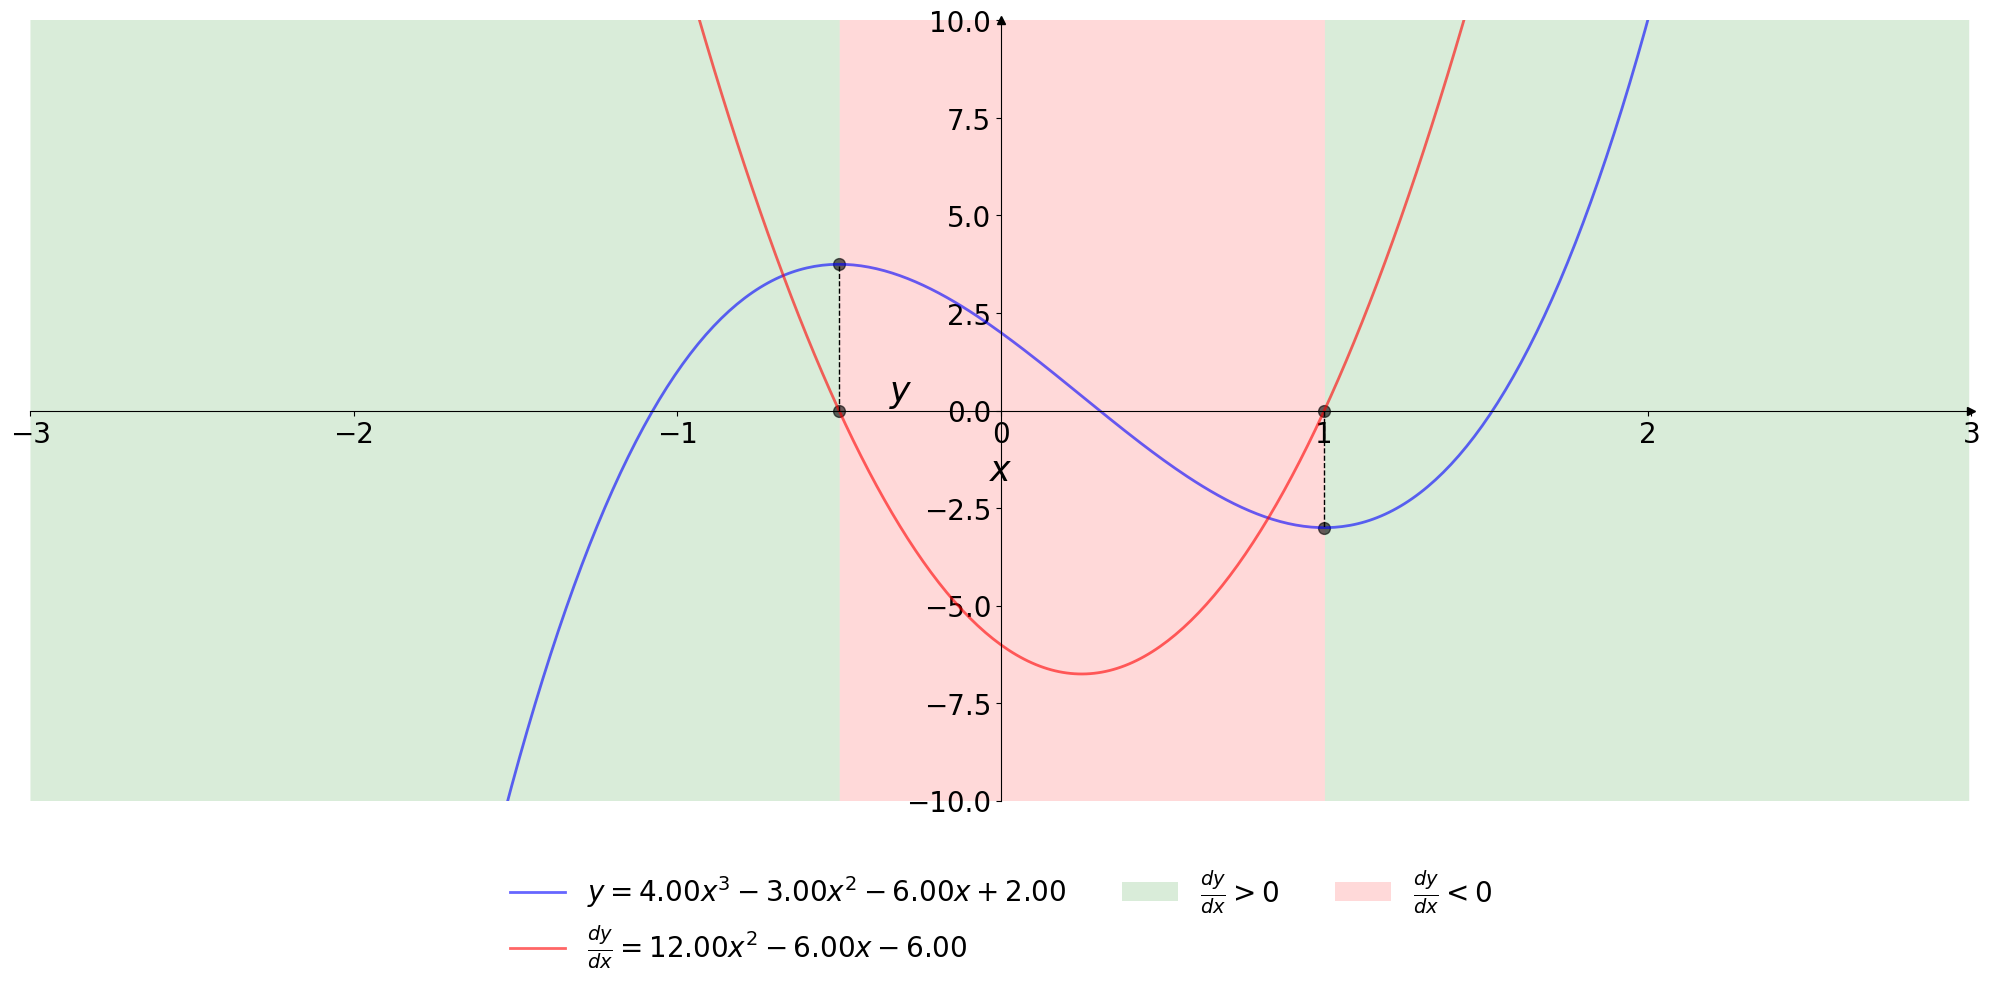
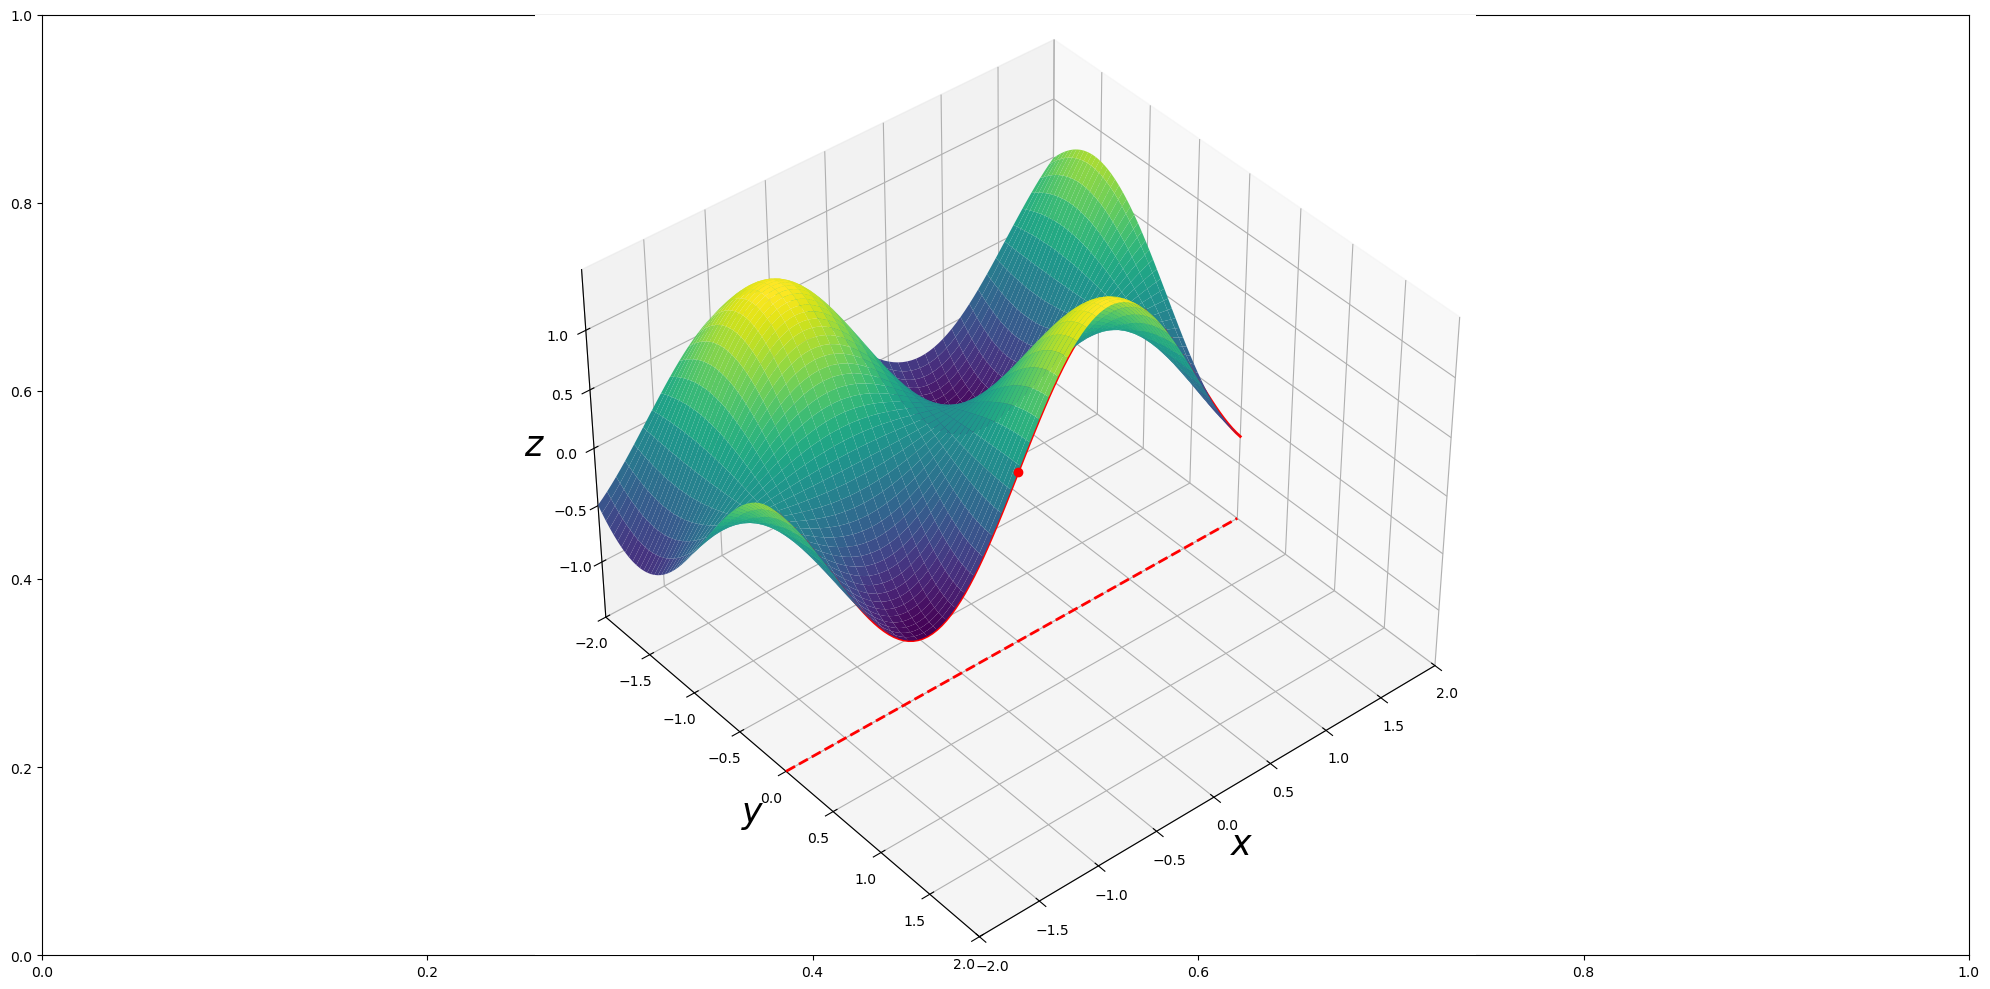
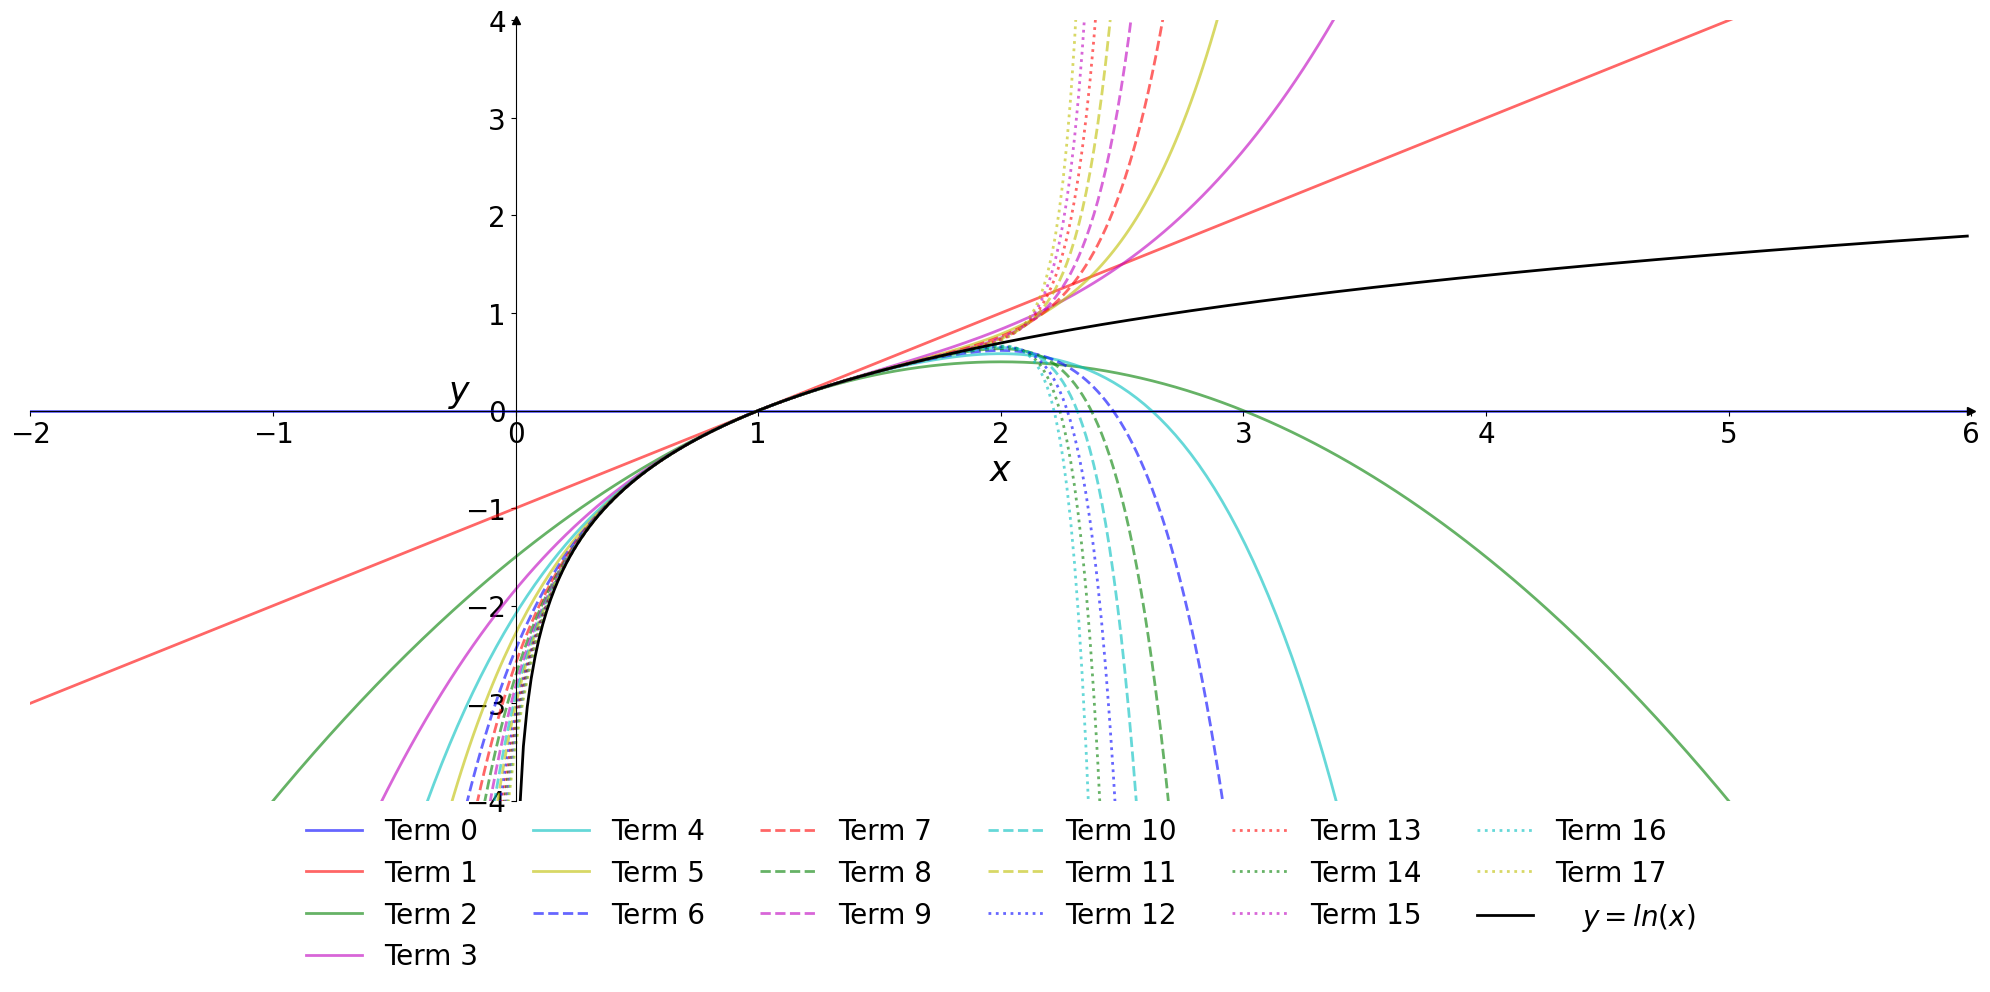
The first set of widgets applies to Mathematics. Our typical student cohort does not have a strong mathematical background, therefore I had to find intuitive ways of presenting and illustrating key maths concepts such as matrices, derivatives, etc. to an audience with limited backgrounds in mathematics. This is where the widgets provide a great visual tool.
Statistics widgets
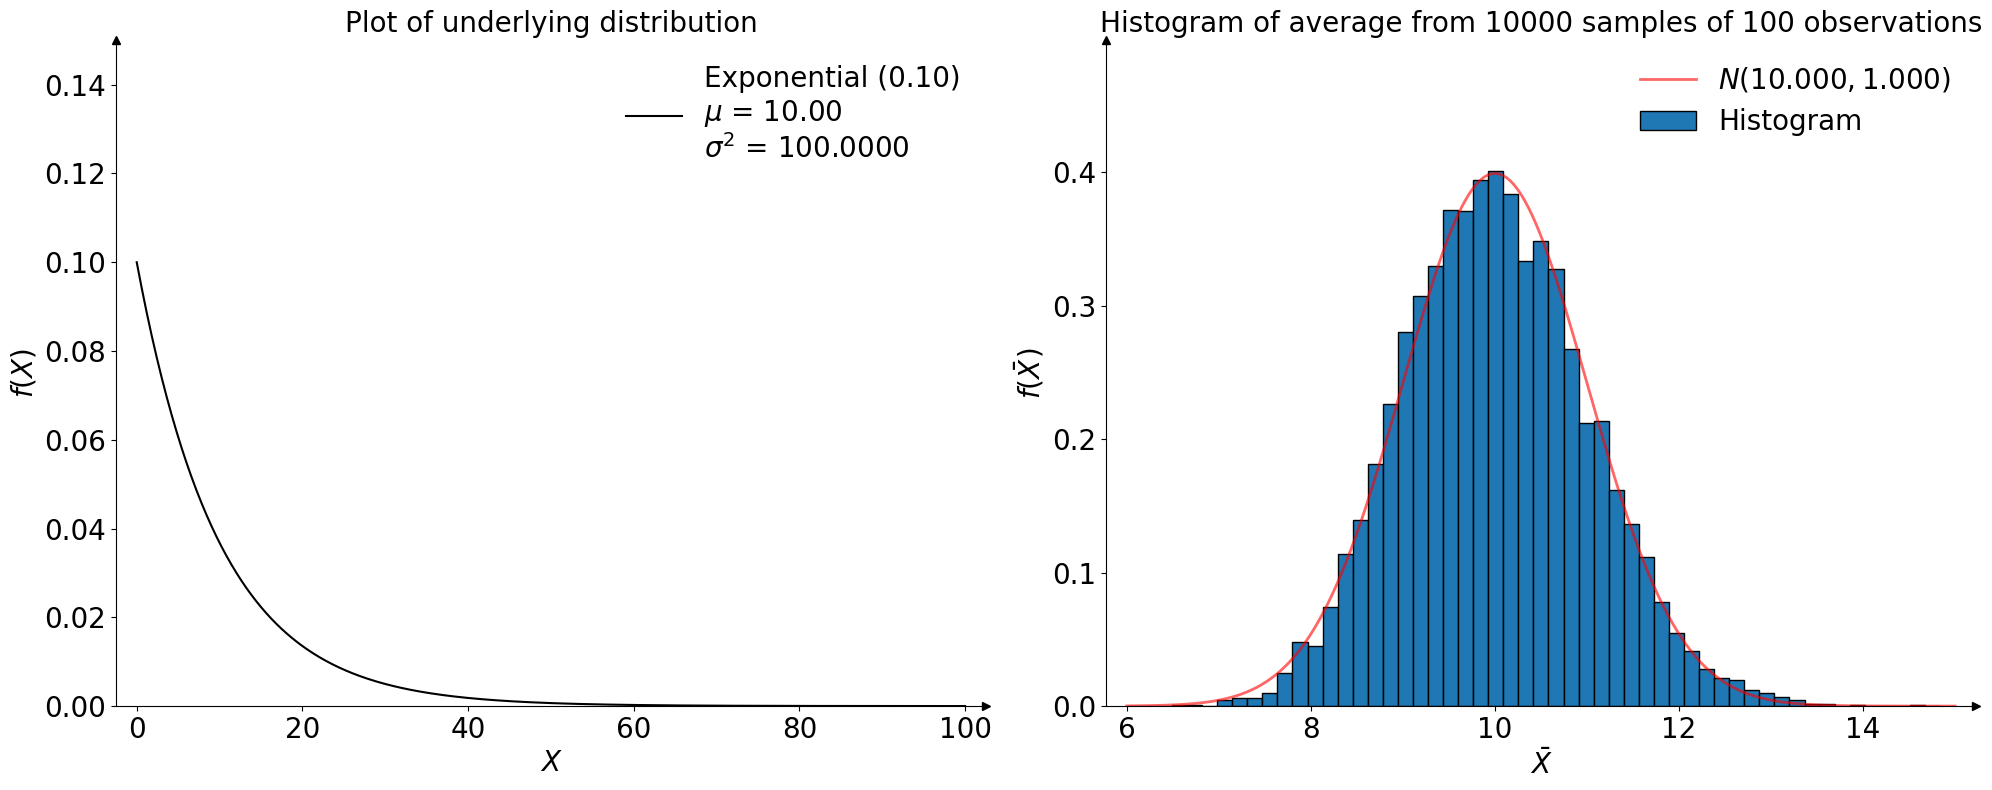
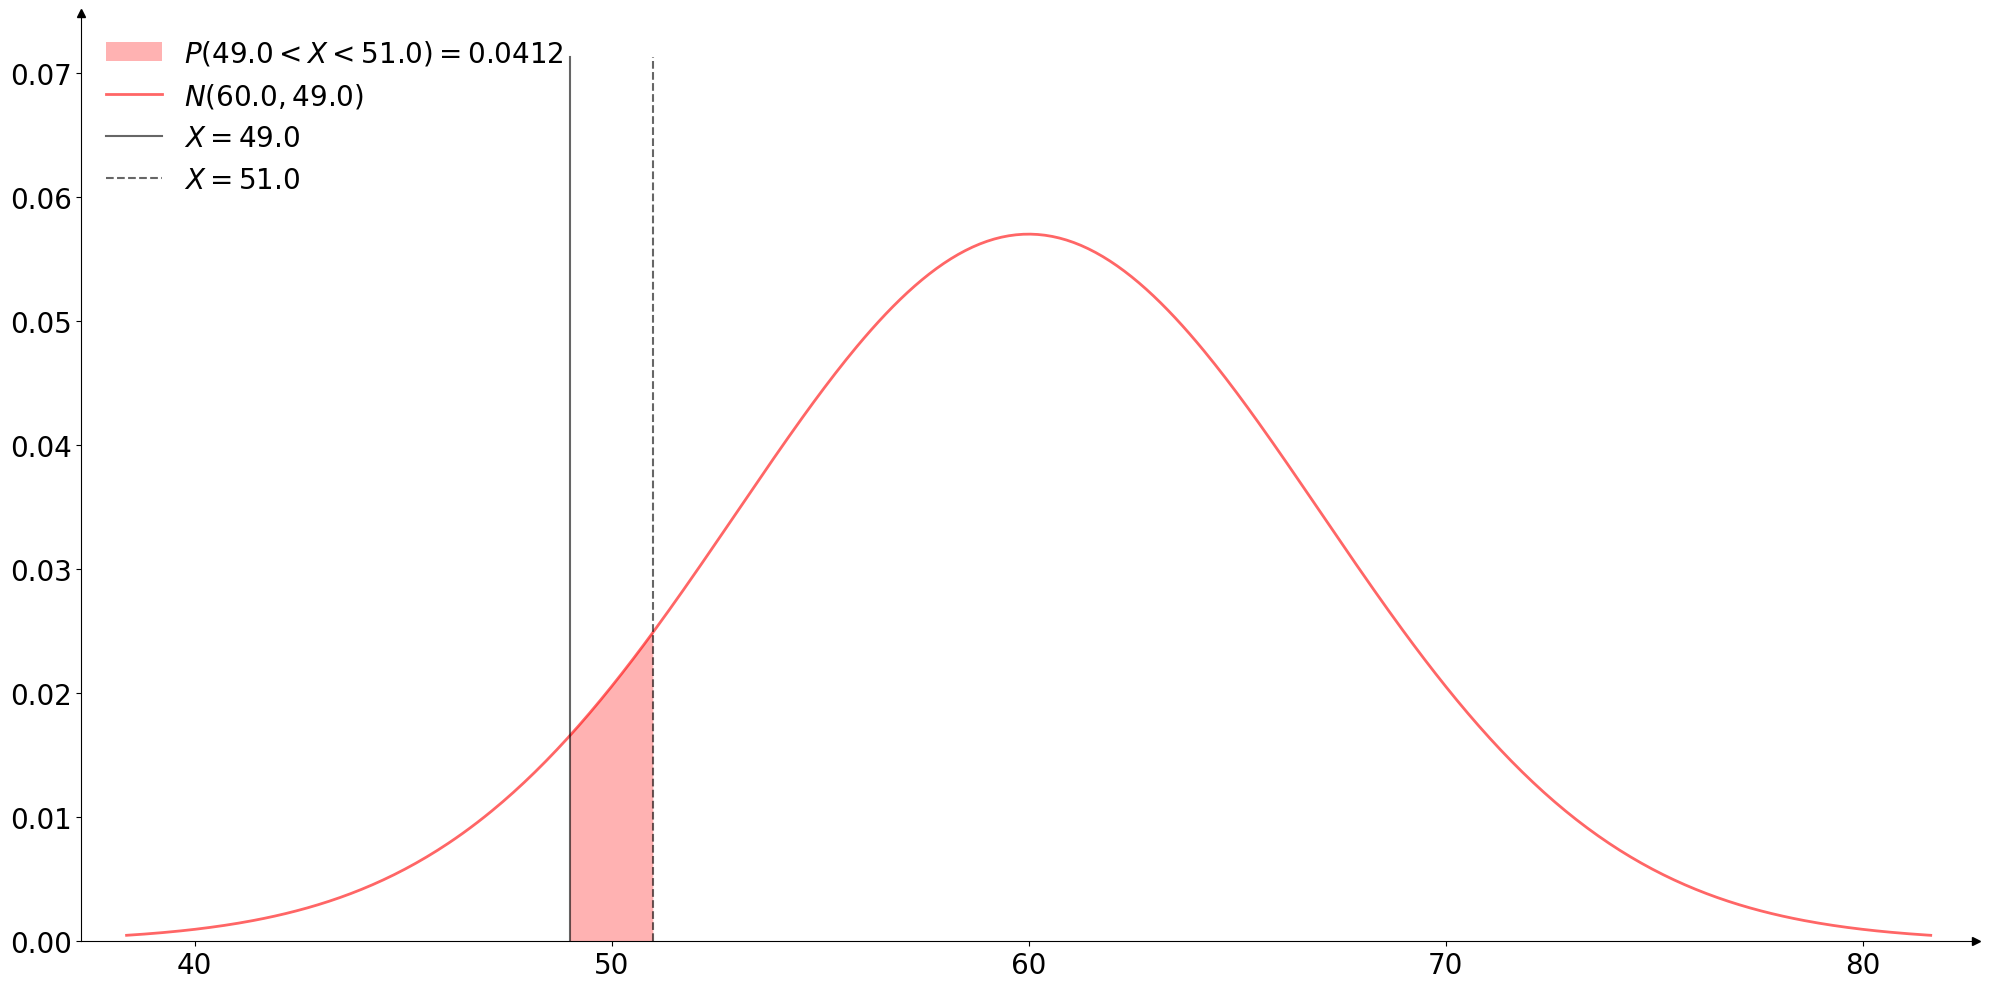
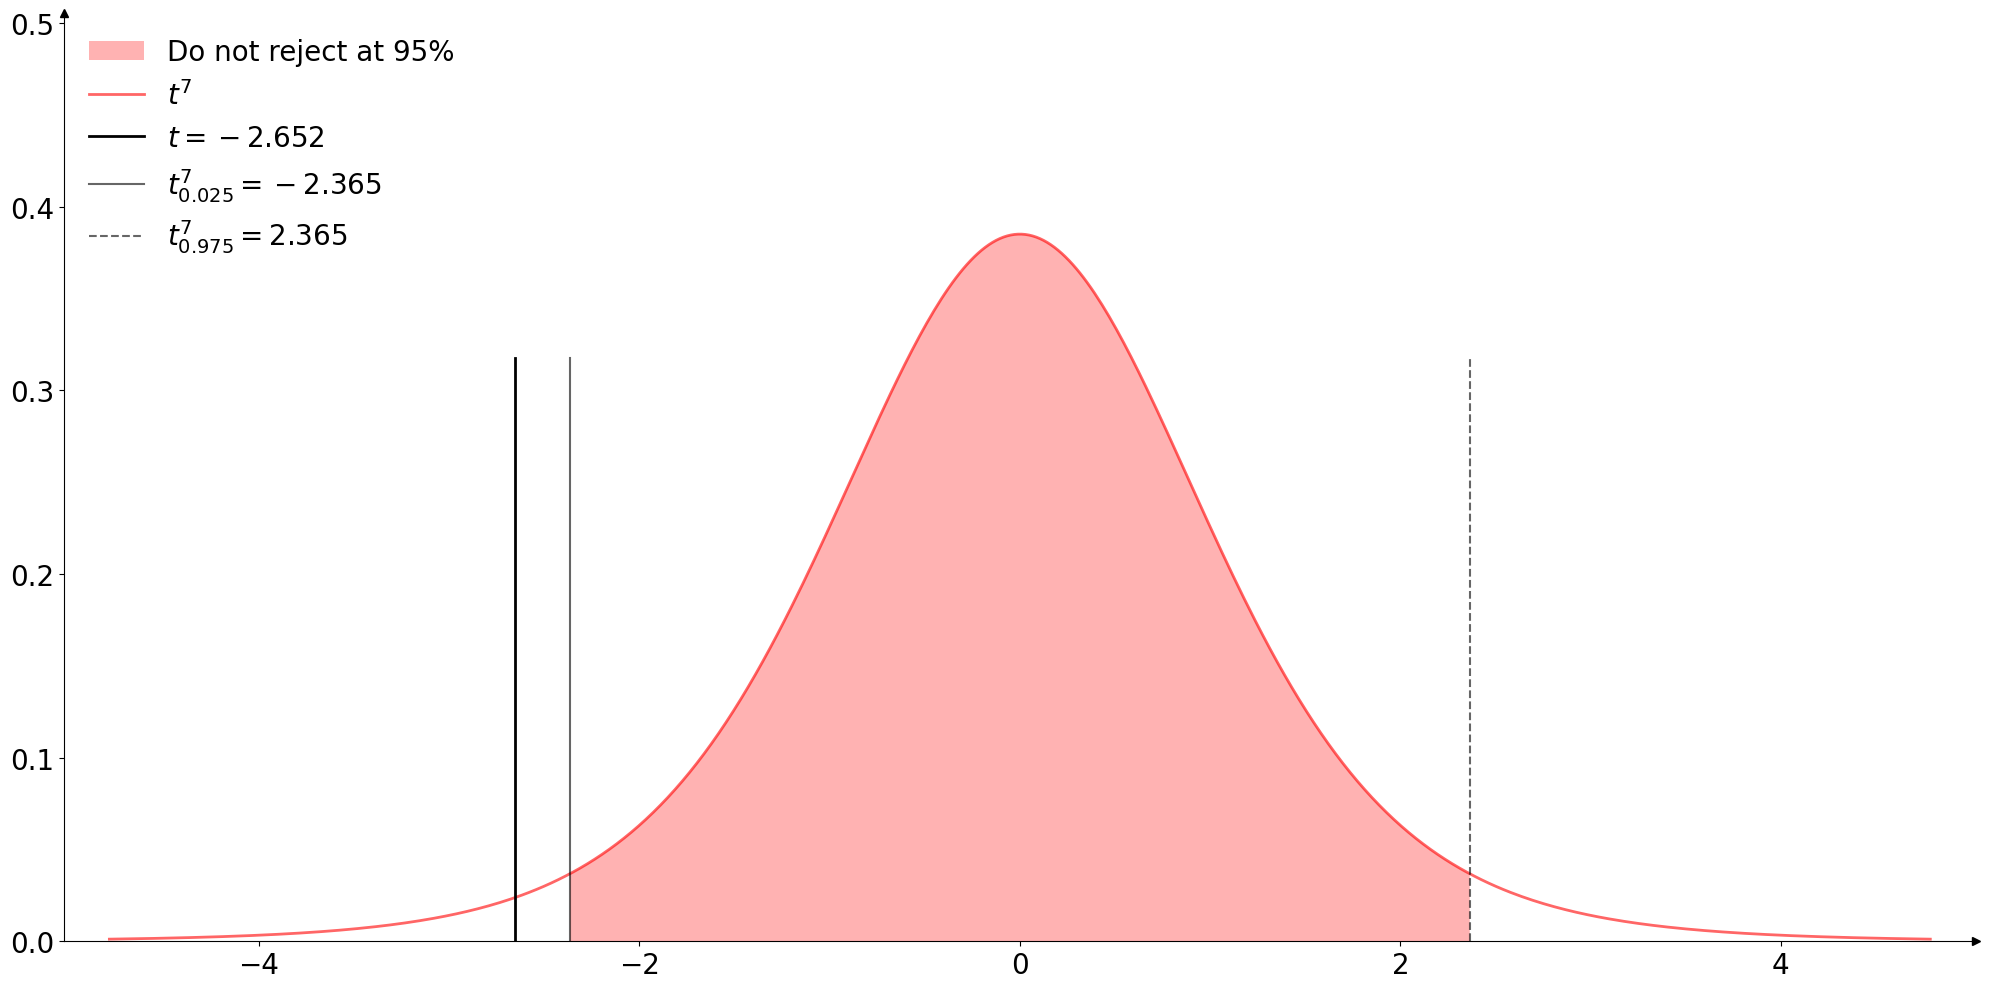
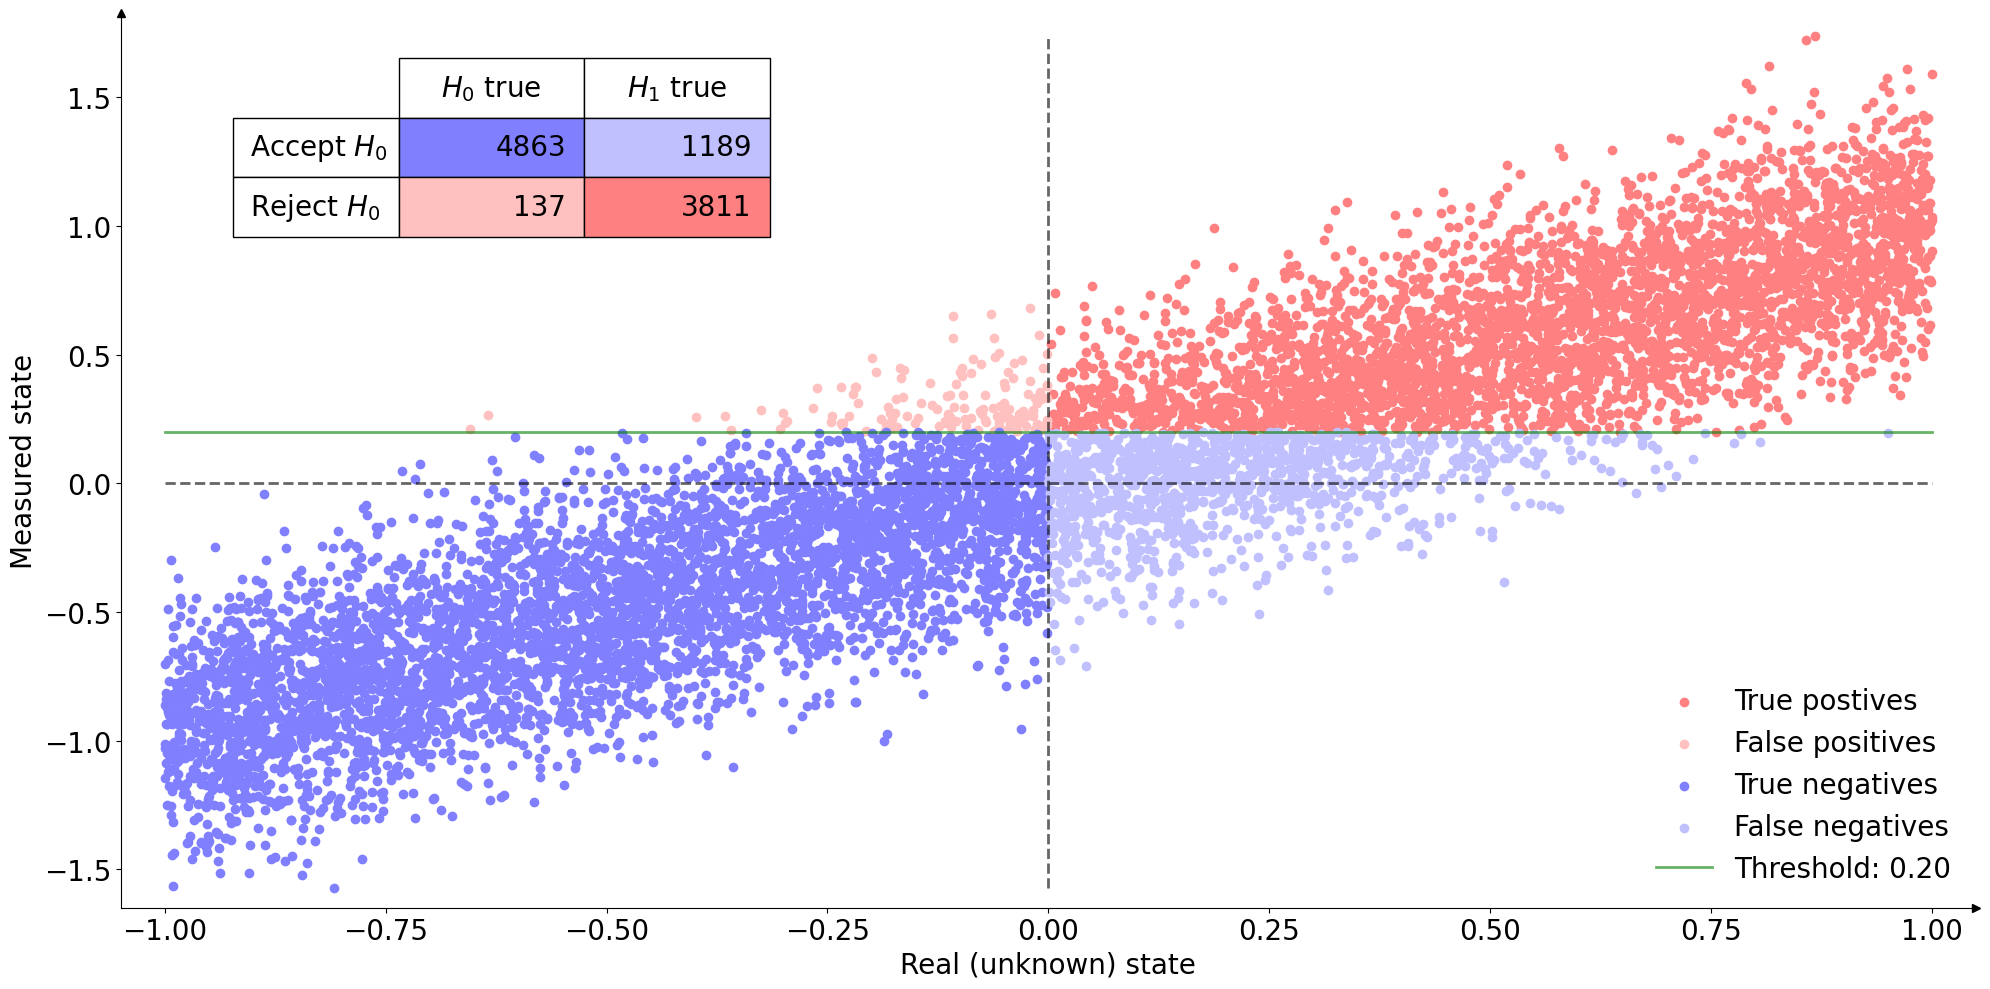
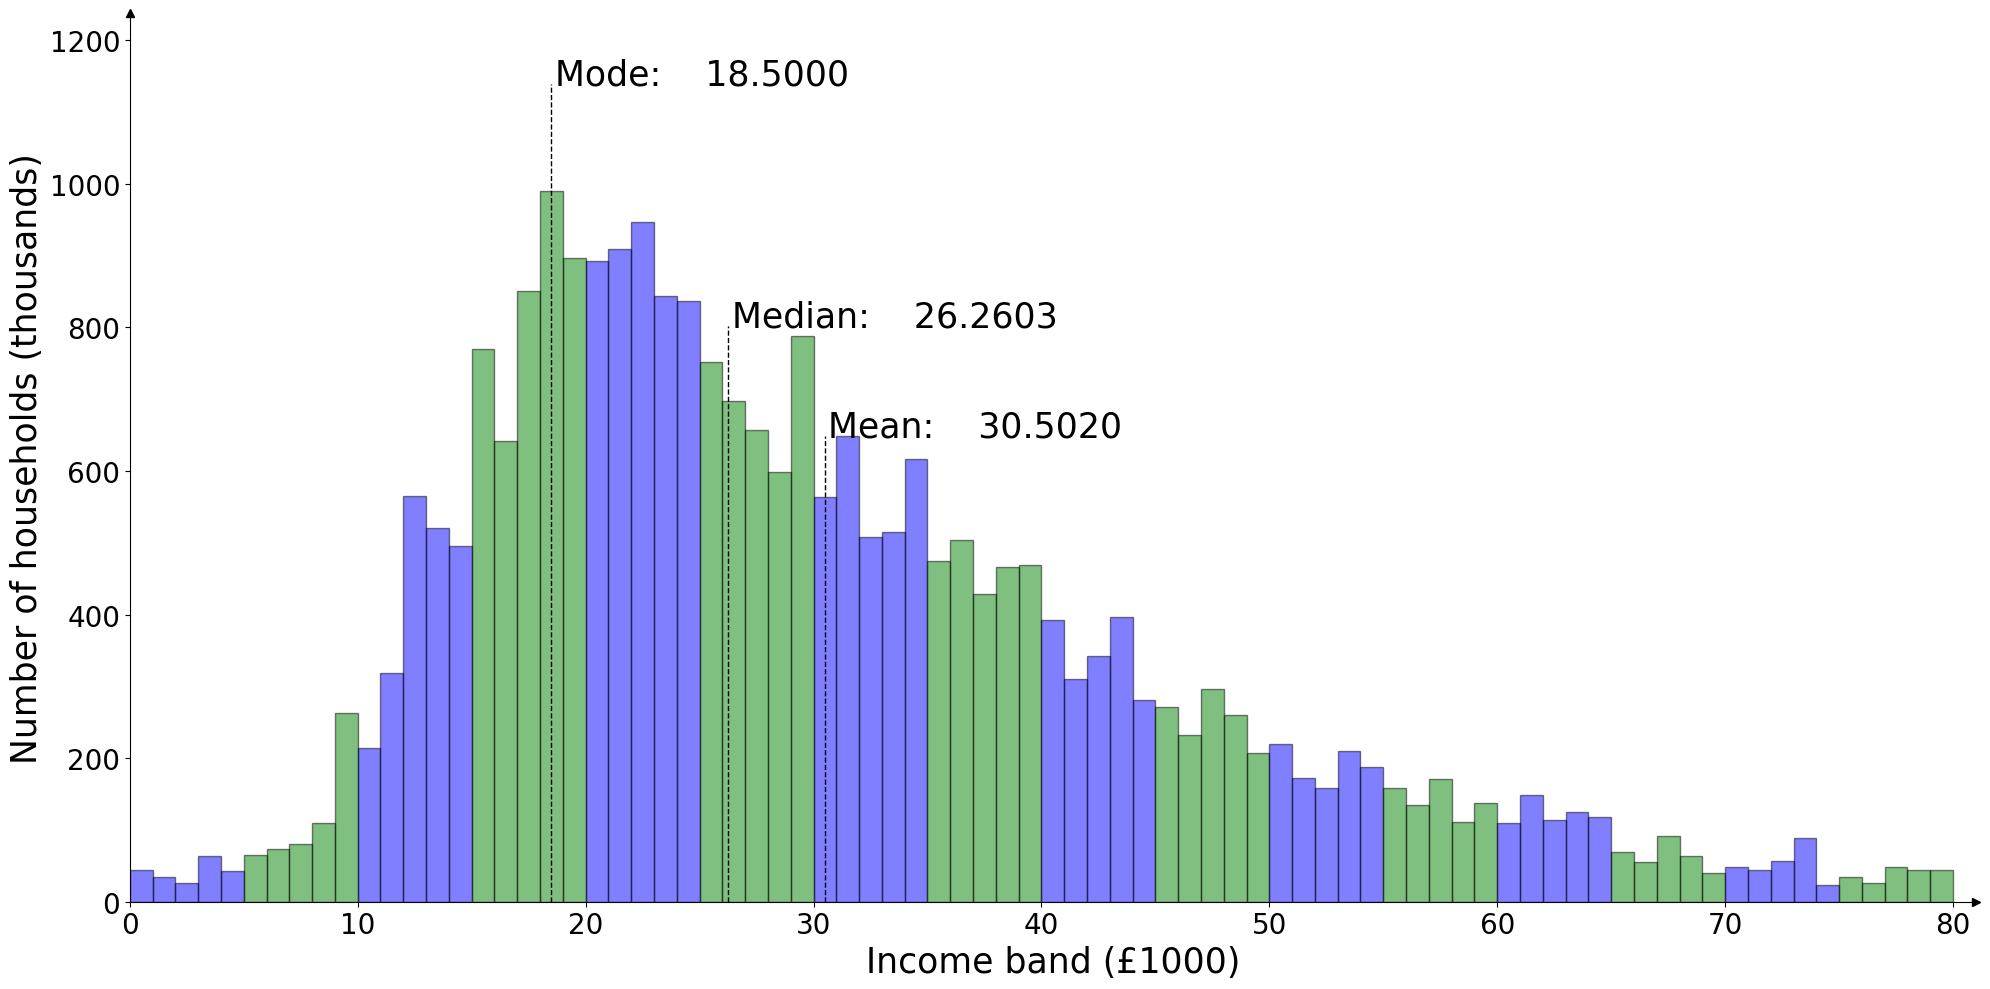
As already stated, the great benefit here is the possibility of running Monte-Carlo exercises in the background of a presentation or notebook, which really helps to present key statistical concepts in an intuitive way. Explaining the central limit theorem, the \(\sqrt{N}\) convergence of sample estimates to population parameters, or the bias/variance trade-off is much easier when you can actually show it live!
Application widgets
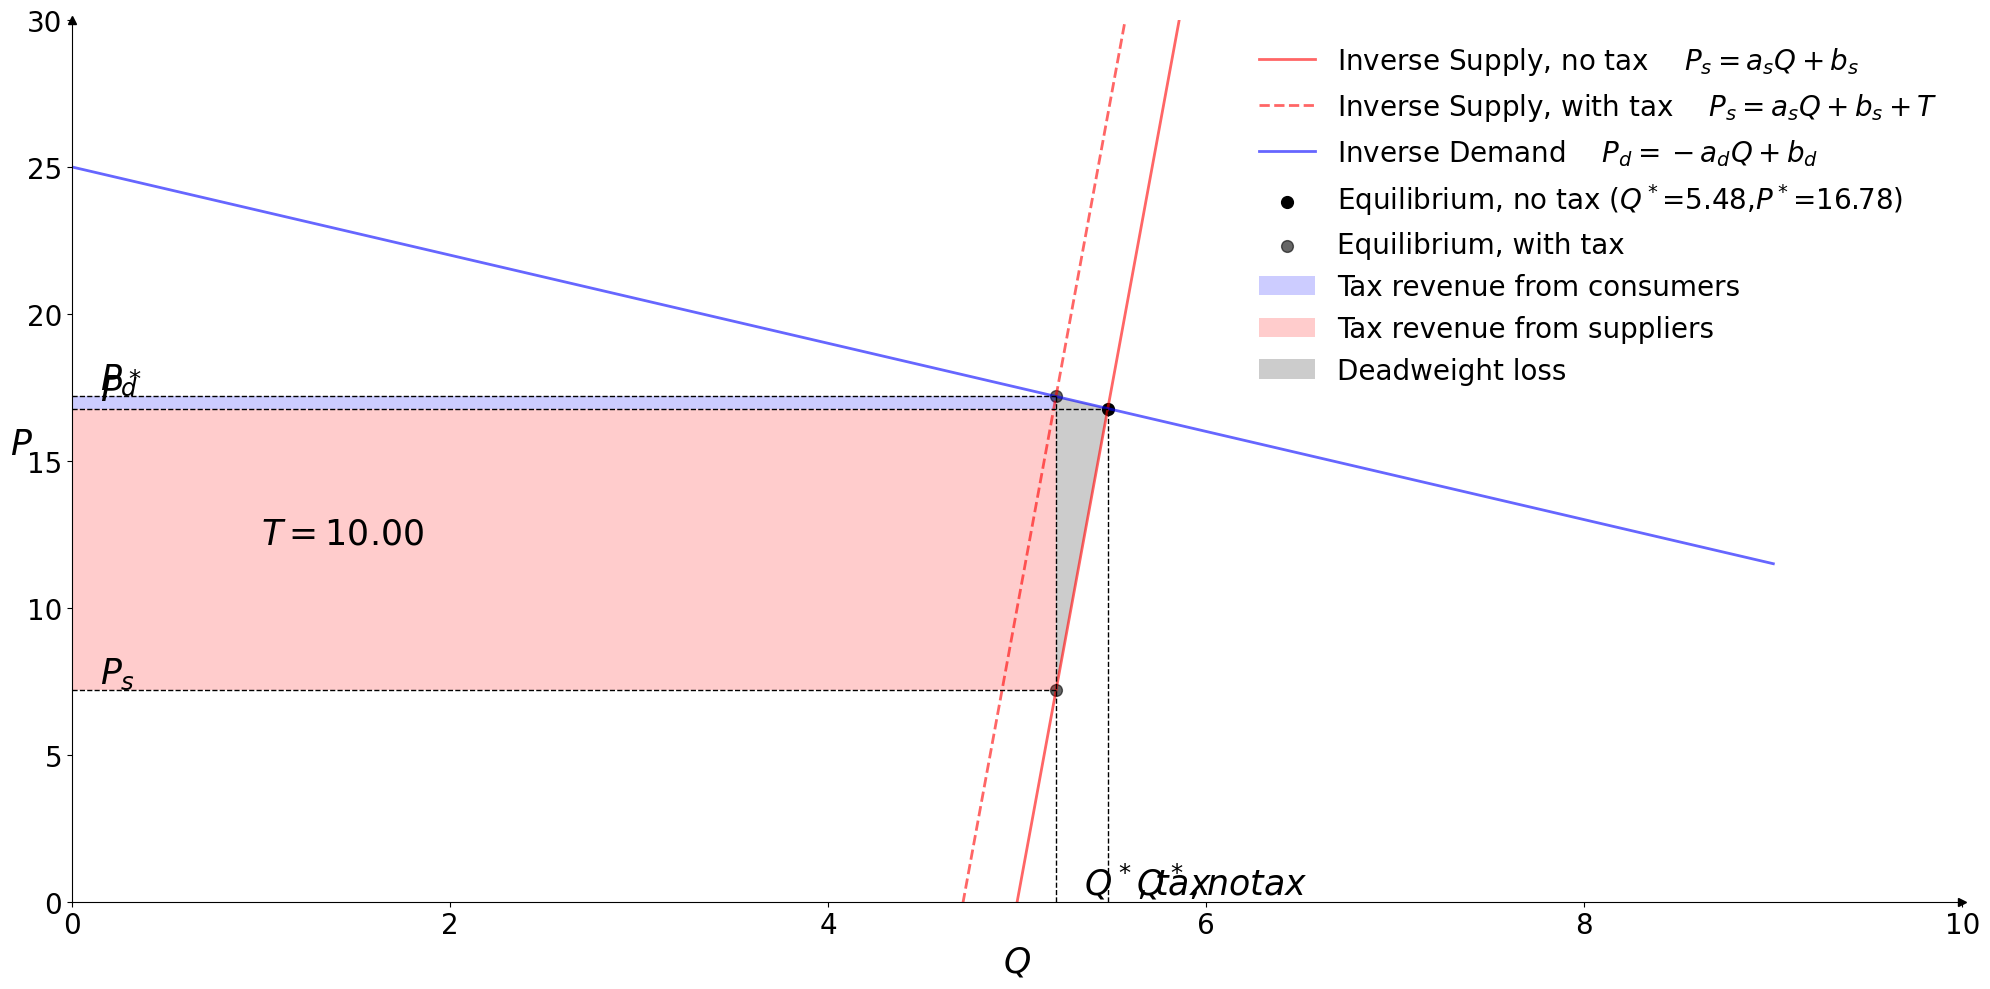
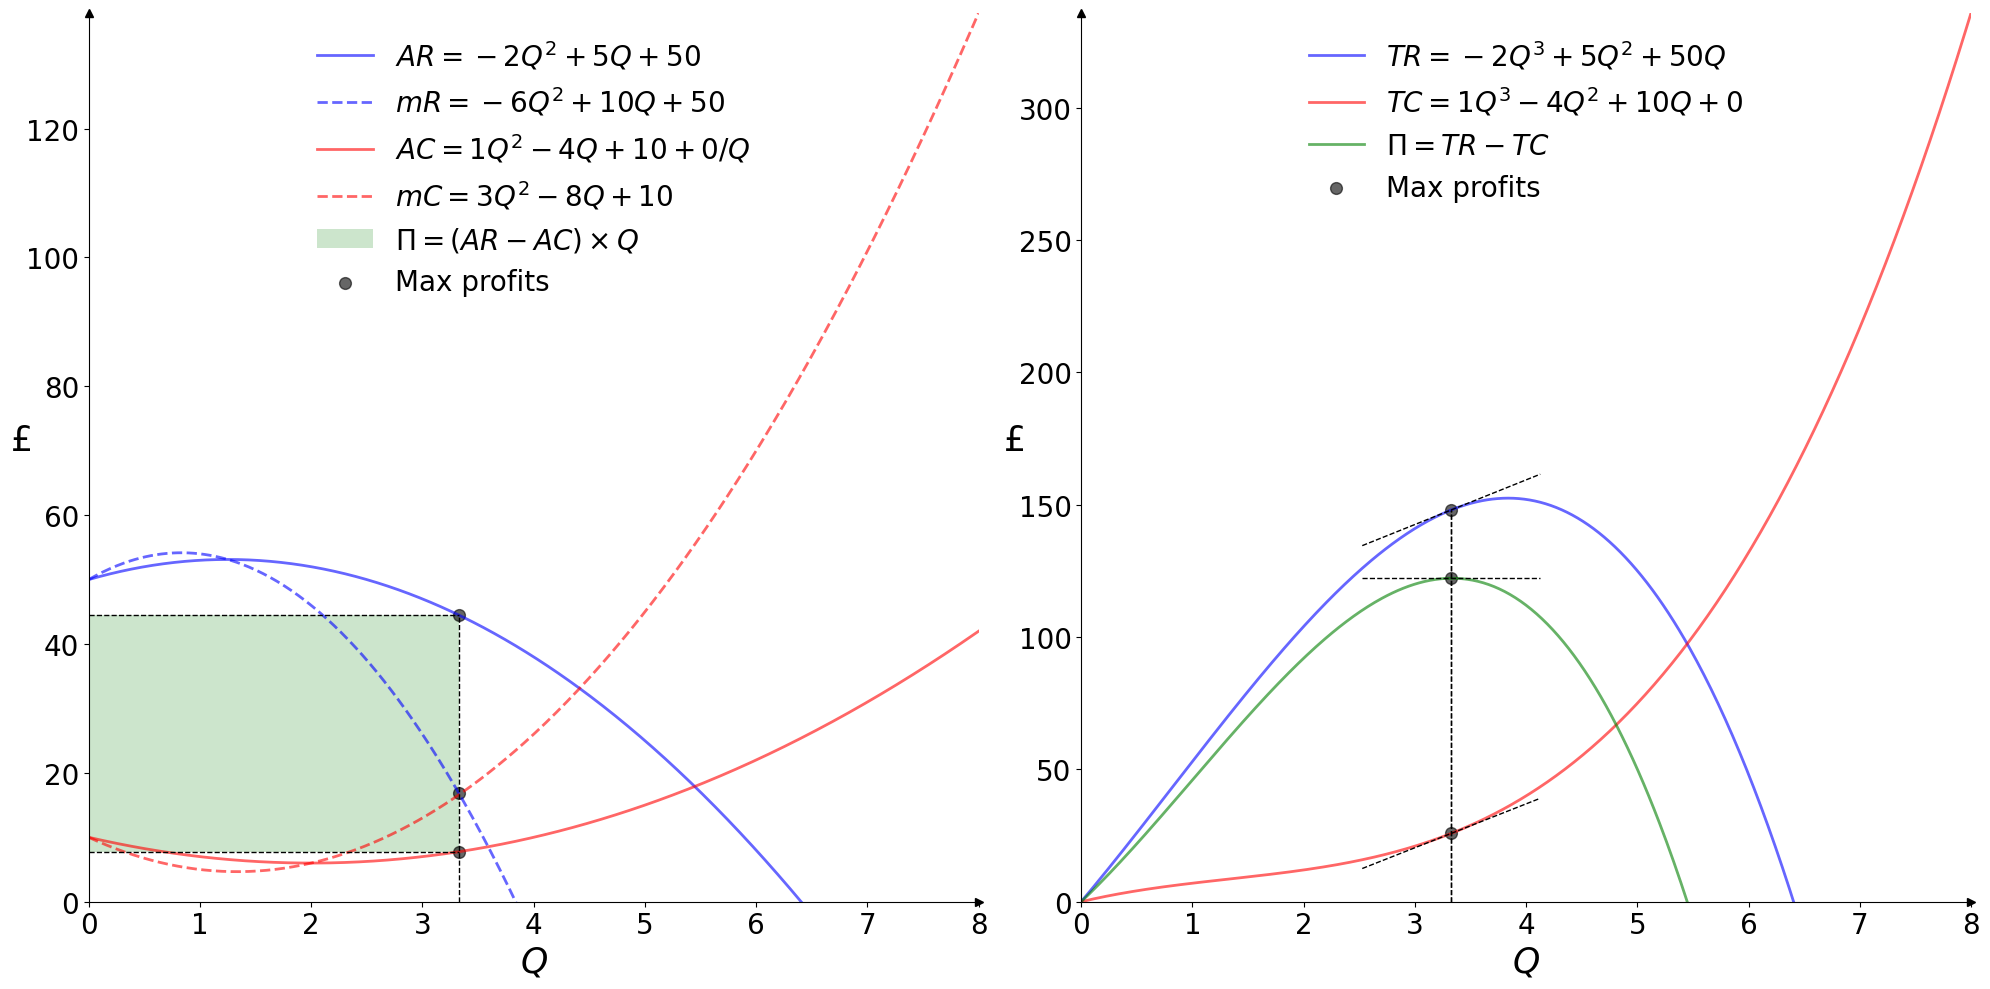
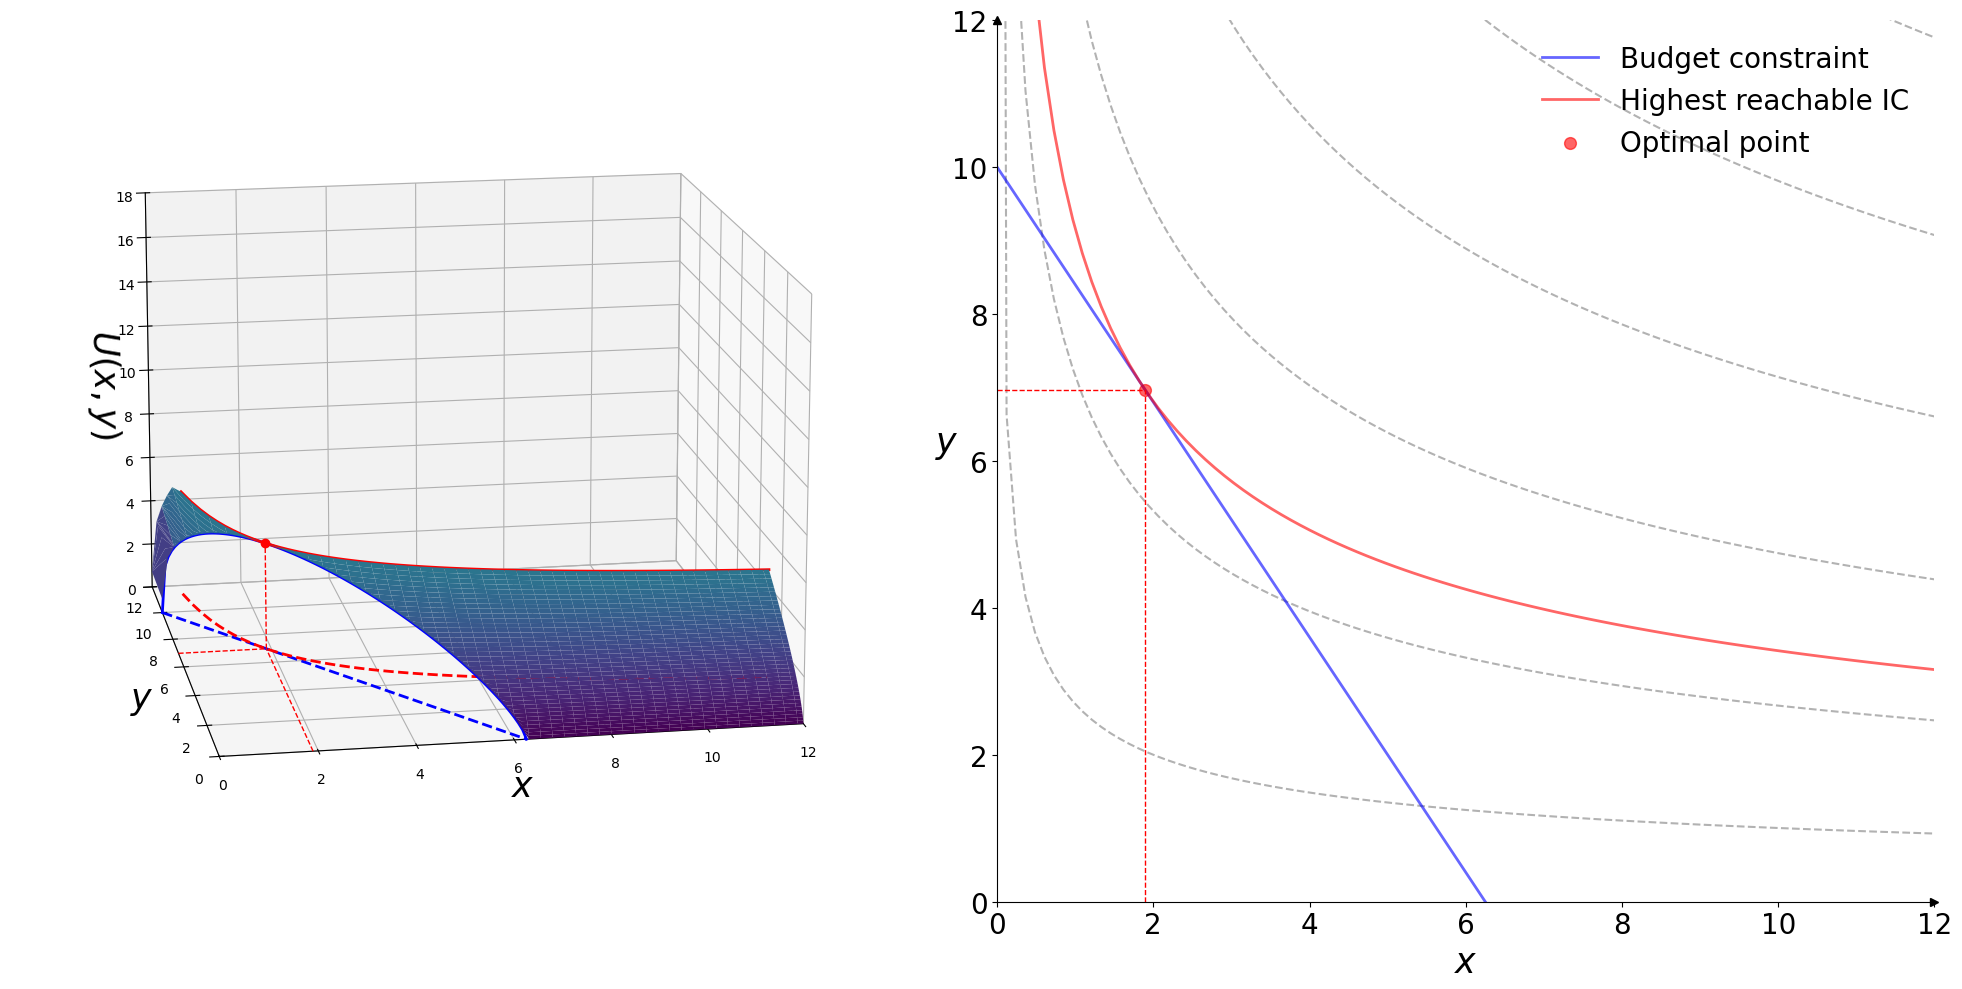
Finally, because the main modules I teach are called ‘Mathematics for Economics’ and ‘Statistics for Economics’, I guess I feel compelled to add some economics content as well… So I also have a range of application widgets, which show how the relevant mathematical/statistical concept is used in the context of economics.
Project contributions
What bits does this project reach that others don’t?
- The main contribution is the incredibly valuable toolkit this provides for explaining core mathematical/statistical/economic concepts in an intuitive and flexible way.
- Once the user gets their head around the logic of how to declare and link the jupyter widgets to the main plot, it becomes really easy to create newer widgets by re-purposing existing ones. The marginal cost of a new widget keeps falling the more of them you have.
- What makes this particularly useful is the fact that this integrates well with RISE and
decktape.jsplugins, creating interactive slideshows that can then be converted to PDF.
Areas of improvement
Things I’m not that happy about right now.
- These work in the classic Jupyter notebook, and have been tested in version 7 of notebooks. However, they do not (yet?) work in JupyterLab, and given that this seems to be the main direction Jupyter is going in, more work is needed to move these to that platform. Work in progress here!